1. ДгЙйЭјбЁдёPrometheusАцБОНјааЯТди
ЙйЭјЕижЗ>> https://github.com/prometheus/prometheus/releases/
2. ЪЕбщАВХХ
дкжїЛњ192.168.153.137ЩЯАВзАprometheusМрПи192.168.153.138ЩЯЕФmysqlЗўЮёКЭжїЛњзДЬЌ
3. ЩЯДЋШэМўАќЕН137ЗўЮёЦїВЂХфжУ
3.1 НЋШэМўАќНтбЙЕН /usr/local ФПТМЯТ
tar xzf prometheus-2.24.1.linux-amd64.tar.gz -C /usr/local/
3.2 ИјФПТМДДНЈШэСДНг
ln -s /usr/local/prometheus-2.24.1.linux-amd64/ /usr/local/prometheus
3.3 ЧаЛЛЕНФПТМЯТ
cd /usr/local/prometheus
3.4 аоИФХфжУЮФМў prometheus.ymlЃЌХфжУвЊМрПиЕФЯю
scrape_configs: # The job name is added as a label `job=<job_name>` to any timeseries scraped from this config. - job_name: 'prometheus' # metrics_path defaults to '/metrics' # scheme defaults to 'http'. static_configs: - targets: ['localhost:9090'] #МрПиLinuxжїЛњзДЬЌ - job_name: 'linux' static_configs: - targets: ['192.168.153.138:9100'] #МрПиmysqlЗўЮёзДЬЌ - job_name: 'mysql' static_configs: - targets: ['192.168.153.138:9104']
3.5 ЦєЖЏpromethusЗўЮё
./prometheus --config.file=prometheus.yml
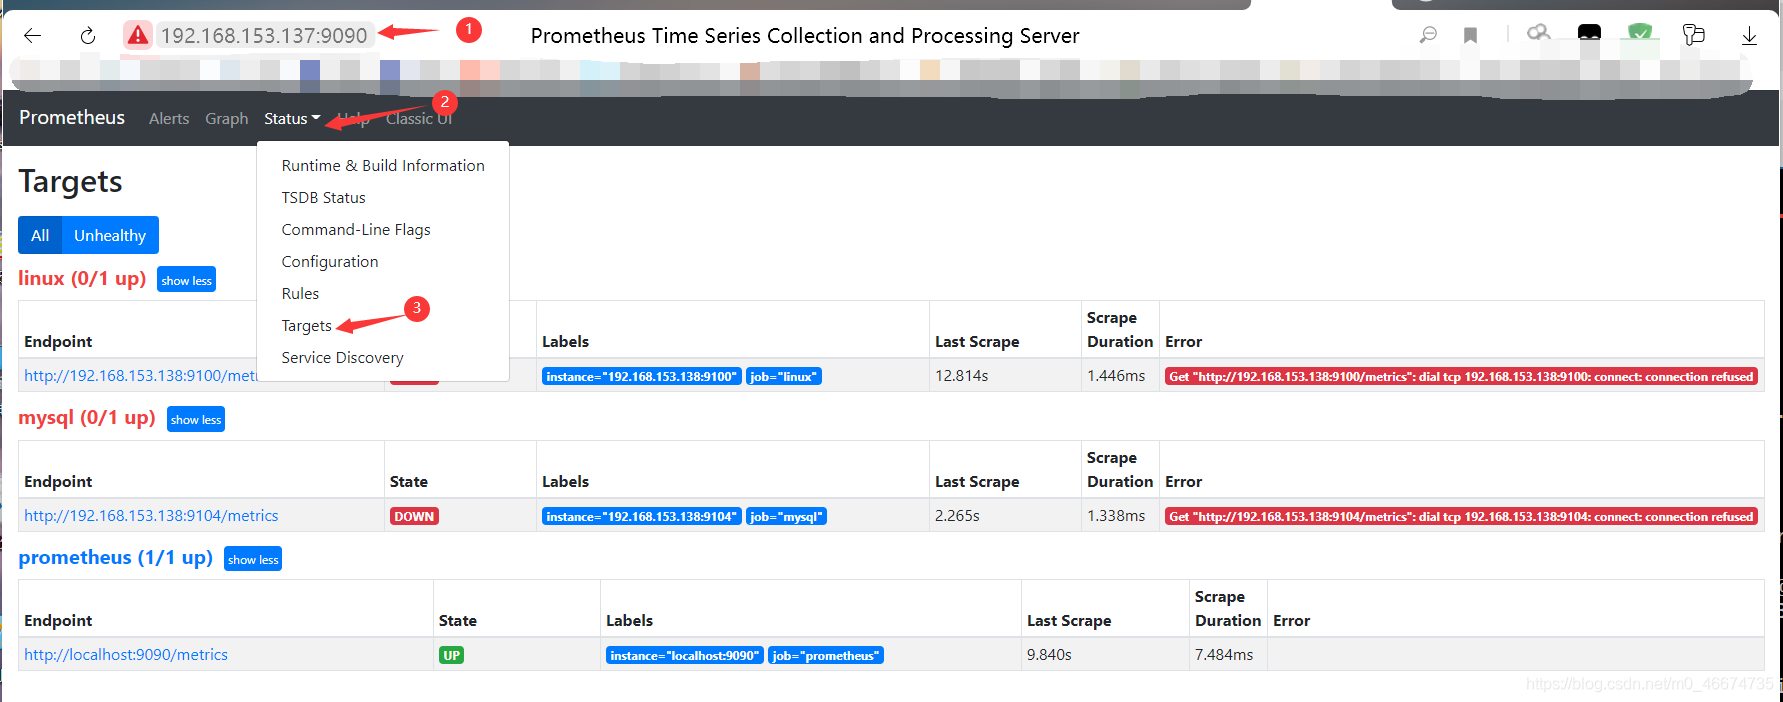
3.6 фЏРРЦїЪфШы IP:9090 ВщПД
дкStatus->TargetsвГУцЯТЃЌЮвУЧПЩвдПДЕНЮвУЧХфжУЕФСНИіTargetЃЌЫќУЧЕФStateЮЊDOWNЁЃ
4. ХфжУ138жїЛњ 4.1 ЯТдиexporter
ЯТдиЕижЗ>> https://github.com/prometheus/node_exporter/releases
4.2 НЋШэМўАќНтбЙЕН /usr/local ФПТМЯТ
tar xzf node_exporter-1.0.1.linux-amd64.tar.gz -C /usr/local/
4.3 ЦєЖЏexporter
nohup /usr/local/node_exporter-1.0.1.linux-amd64/node_exporter &
4.4 ЯТдиmysqld_exporter
ЯТдиЕижЗ>> https://github.com/prometheus/mysqld_exporter/releases
4.5 НЋШэМўАќНтбЙЕН /usr/local ФПТМЯТ
tar xzf mysqld_exporter-0.12.1.linux-amd64.tar.gz -C /usr/local/
4.6 Ъ§ОнПтИјmysqld_exporterЪкШЈ
[root@host-138 ~]# mysql
Welcome to the MariaDB monitor. Commands end with ; or \g.

MariaDB [(none)]> GRANT REPLICATION CLIENT,PROCESS ON *.* TO 'mysql_monitor'@'localhost' identified by 'mysql_monitor';
Query OK, 0 rows affected (0.00 sec)

MariaDB [(none)]> GRANT SELECT ON *.* TO 'mysql_monitor'@'localhost';
Query OK, 0 rows affected (0.00 sec)
4.7 ДДНЈ .my.cnf ХфжУЮФМў
vim /usr/local/mysqld_exporter-0.12.1.linux-amd64/.my.cnf
ФкШнЮЊЃК
[client]
user=mysql_monitor
password=mysql_monitor
4.8 дЫааmysqld_exporterЗўЮё
nohup /usr/local/mysqld_exporter-0.12.1.linux-amd64/mysqld_exporter --config.my-cnf="/usr/local/mysqld_exporter-0.12.1.linux-amd64/.my.cnf" &
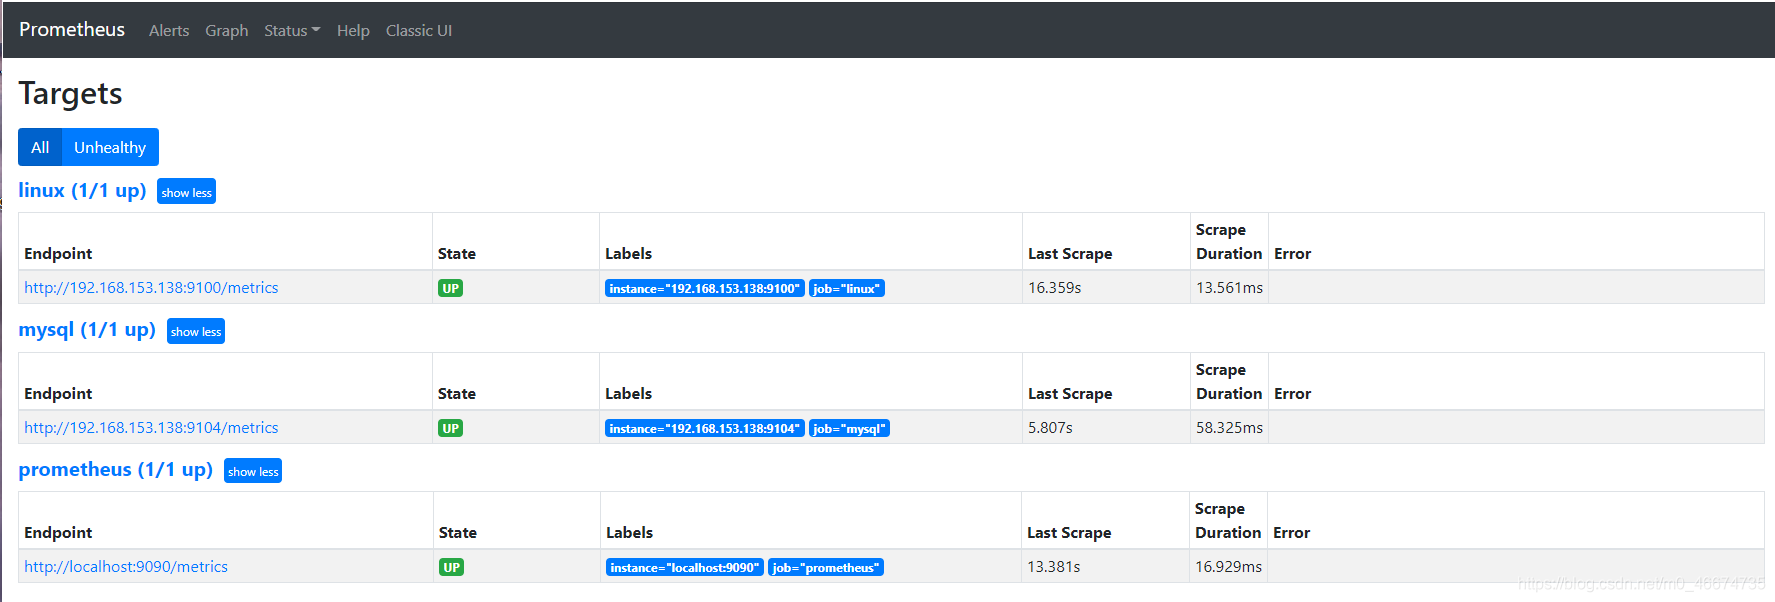
5. дкpromethusвГУцЫЂаТStatus->TargetsвГУцЃЌПЩвдПДЕНХфжУЕФСНИіTargetЕФStateЮЊUPЃК
5. дк137жїЛњЩЯАВзАВПЪ№grafana
АВзАНЬГЬСДНг>>https://www.jb51.net/article/204660.htm
5.1 ЬэМгpromethusЪ§ОндД ЮДЭъД§ајЁ
ЕНДЫетЦЊЙигкPrometheusЕФАВзАКЭХфжУНЬГЬЯъНтЕФЮФеТОЭНщЩмЕНетСЫ,ИќЖрЯрЙиPrometheusАВзАКЭХфжУФкШнЧыЫбЫїз№ЭадЦЪ§вдЧАЕФЮФеТЛђМЬајфЏРРЯТУцЕФЯрЙиЮФеТЯЃЭћДѓМввдКѓЖрЖржЇГжз№ЭадЦЪ§ЃЁ
БОЮФзЊдиздЭјТчЃЌдЮФСДНгЃКhttps://m.jb51.net/article/204659.htm
АцШЈЩљУїЃКБОЮФзЊдиздЭјТчЃЌзёб CC 4.0 BY-SA АцШЈавщЃЌзЊдиЧыИНЩЯдЮФГіДІСДНгКЭБОЩљУїЁЃБОеОзЊдиГігкДЋВЅИќЖргХауММЪѕжЊЪЖжЎФПЕФЃЌШчгаЧжШЈЧыСЊЯЕQQ/ЮЂаХЃК153890879ЩОГ§
 ЯрЙиЮФеТ
-

Vue SPA ЪзЦСгХЛЏЗНАИ
-
vue ЖЏЬЌЬэМгЕФТЗгЩвГУцЫЂаТЪБЪЇаЇЕФд
-
vueЯюФПХфжУ webpack-obfuscator Нјаа
-
JavaScript жаЕФжДааЩЯЯТЮФКЭжДааеЛЪЕ

 ОЋВЪЕМЖС
 ШШУХзЪбЖ