
����ת�����Ź��ںš�python������ݷ�����������һֻСС����ת�ر�������ϵpython������ݷ������ںš�
������û���¹��ںţ�һ���ǹ����е�æ�������DZ���ͼ��������͵IJ����ˣ�����û�����ǰд�ĵ��Ƕ��Լ����IJ����أ�����choropleth_mapbox��ͼʵ�֣��кܶ�������档��Ҫ�������Ƕ�geojson�����˽⣬�Լ�choropleth_mapbox�Բ����Ľ���һֱ����֮���ꡣ
GeoJSON��һ�ֶԸ��ֵ������ݽṹ���б���ĸ�ʽ��GeoJSON����json�������ʹ洢�������ݣ�����˵��json���Ӽ���GeoJSON������Ա�ʾ���Ρ����������������ϡ�GeoJSON֧�����漸�����ͣ��㡢�ߡ��桢��㡢���ߡ�����ͼ��μ��ϡ�GeoJSON�����������һ�����ζ�����������ԣ��������ϱ�ʾһϵ��������
GeoJSON������һ�������Ķ�����ɡ���������ʾ���Ρ����������������ϡ�
GeoJSON����������κ���Ŀ��Ա��
GeoJSON���������һ������Ϊ"type"�ij�Ա�������Ա��ֵ����GeoJSON�����������ȷ�����ַ�����
type��Ա��ֵ����������֮һ��"Point", "MultiPoint", "LineString", "MultiLineString", "Polygon", "MultiPolygon", "GeometryCollection", "Feature", ���� "FeatureCollection"��
�����Ǹ�geojosn������
- {
- "type": "FeatureCollection",
- "features": [
- {"type":"Feature",
- "properties":{},
- "geometry":{
- "type":"Point",
- "coordinates":[105.380859375,31.57853542647338]
- }
- }
- ]
- }
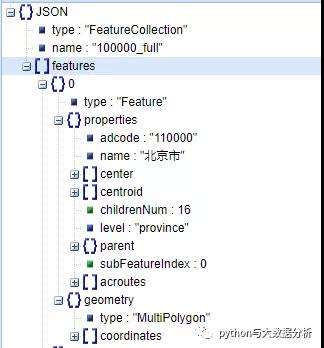
����ȫ���ͼ���й���ͼ��ʡ���ͼ��geojson�ļ����������ص�������ʽ�������𣬱���ȫ���ͼ��id�����Ҽ�д����properties�µ�name��Ҳ��ȫ�ơ�
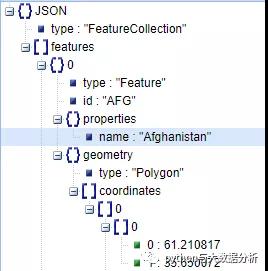
���й���ͼ��adcode��name���������ĵ�ȵ����ԡ�
��ʵ��choropleth_mapbox�Ĺ����У���ͼһֱ��������ʾ��ԭ���ж�����һplotly����d3.js��geojson�ļ��ļ��رȽϺ�ʱ������Ҫ��Ϊ���һ��zoom out��ť���ܳ��ֵ�ͼ������������ԣ�������Ĵ���ע�������н��ܣ��ڴ˲��������ˡ����е����ݾ�Ϊ���ֵ���������κκ��塣
- import json
- import pandas as pd
- import plotly.express as px
- def print_json(data):
- print(json.dumps(data, sort_keys=True, indent=4, separators=(', ', ': '), ensure_ascii=False))
- with open('countries.geo.json') as response:
- counties = json.load(response)
- df = pd.read_csv("datarand.csv",encoding="utf-8")
- # �����ͼ����ָ����ֵ��Ĭ�ϲ���geojson�е�idֵ�������Ҽ�д�����ݱ����е���ҲҪΪ���Ҽ�д����country��
- fig = px.choropleth_mapbox(df, geojson=counties,locations='country', color='key1',
- color_continuous_scale=px.colors.diverging.RdYlGn[::-1],
- range_color=(100, 10000),
- mapbox_style="carto-positron",
- zoom=1,
- center={"lat": 37.4189, "lon": 116.4219},
- opacity=0.5
- )
- fig.update_layout(margin={"r":0,"t":0,"l":0,"b":0})
- fig.show()

- # �����ͼ��ָ��properties.name����������Ϊ��ֵ�����ݱ����е���ҲҪ��Ϊ���ң���locations��
- fig = px.choropleth_mapbox(df, geojson=counties, featureidkey="properties.name",locations='name', color='key1',
- color_continuous_scale="Viridis",
- range_color=(100, 10000),
- mapbox_style="carto-positron",
- zoom=1,
- center={"lat": 37.4189, "lon": 116.4219},
- opacity=0.5
- )
- fig.update_layout(margin={"r":0,"t":0,"l":0,"b":0})
- fig.show()

- # �����ͼ��ָ��id���Ҽ�д��Ϊ��ֵ�����ݱ����е���ҲҪ��Ϊ���Ҽ�д����country��
- fig = px.choropleth_mapbox(df, geojson=counties, featureidkey="id",locations='country', color='key1',
- color_continuous_scale="Reds",
- range_color=(100, 10000),
- mapbox_style="carto-positron",
- zoom=1,
- center={"lat": 37.4189, "lon": 116.4219},
- opacity=0.5
- )
- fig.update_layout(margin={"r":0,"t":0,"l":0,"b":0})
- fig.show()

- # �����ͼ����ָ����ֵ��Ĭ�ϲ���geojson�е�idֵ�������Ҽ�д�����ݱ����е���ҲҪΪ���Ҽ�д����country�У���color_continuous_scale��������
- fig = px.choropleth_mapbox(df, geojson=counties, locations='country', color='key1',
- range_color=(100, 10000),
- color_continuous_scale=[
- [0, 'lightcoral'], # �������Ҫд����������
- [1. / 3000, 'indianred'],
- [1. / 300, 'brown'],
- [1. / 30, 'firebrick'],
- [1 / 3, 'maroon'],
- [1., 'darkred']],
- zoom=1,
- center={"lat": 37.4189, "lon": 116.4219},
- mapbox_style='carto-positron')
- fig.update_layout(margin={"r": 0, "t": 0, "l": 0, "b": 0})
- fig.show()

- # �й���ͼ
- with open('china_geo.json') as response:
- counties = json.load(response)
- df = pd.read_csv("data.csv",encoding="utf-8",
- dtype={"areacode": str})
- fig = px.choropleth_mapbox(df, geojson=counties, featureidkey="properties.adcode",locations='areacode', color='confirm',
- #color_continuous_scale="Viridis",
- range_color=(1, 80000),
- color_continuous_scale=[
- [0, 'lightcoral'], # �������Ҫд����������
- [1. / 3000, 'indianred'],
- [1. / 300, 'brown'],
- [1. / 30, 'firebrick'],
- [1 / 3, 'maroon'],
- [1., 'darkred']],
- zoom=3, center={"lat": 37.4189, "lon": 116.4219},
- mapbox_style='carto-positron')
- fig.update_layout(margin={"r": 0, "t": 0, "l": 0, "b": 0})
- fig.show()

- # ���ϵ�ͼ
- with open('460000-hainan.json') as response:
- counties = json.load(response)
- df = pd.read_csv("hainandata.csv",encoding="utf-8",
- dtype={"areacode": str})
- fig = px.choropleth_mapbox(df, geojson=counties, featureidkey="properties.adcode",locations='areacode', color='confirm',
- # color_continuous_scale="Geyser",
- color_continuous_scale='Reds',
- #color_continuous_scale=px.colors.diverging.RdYlGn[::-1],
- range_color=(1, 1500),
- zoom=6, center={"lat": 20.031971, "lon": 110.33119},
- mapbox_style='carto-positron')
- fig.update_layout(margin={"r": 0, "t": 0, "l": 0, "b": 0})
- fig.show()

����ת�������磬ԭ�����ӣ�https://mp.weixin.qq.com/s/V7rtBfqAWd63natJJG_IPQ
 �������


 ���ʵ���

 ������Ѷ